Sydney’s 2025 market is sharply divided: affordable areas are rising, mid-priced regions are stable, and prestige districts are falling. This report highlights the data behind the split and what it could mean for 2026.
Sydney’s 2025 market is sharply divided: affordable areas are rising, mid-priced regions are stable, and prestige distri
Read the full analysis below
Source: Knest.ai research
Where are Sydney’s Major Prestige Home Districts?
These three regions are the ones you’ll want to keep an eye on — they’re set to play a very different role in Sydney’s property performance in 2025.
Even if you’re not actively following the prestige market, the forces driving price movements at the top end often ripple through to other suburbs.
While many reports suggest Sydney house prices are expected to edge higher this year, what matters more is the variation across individual districts. The patterns in 2025 have been unusually consistent, almost as if the market is sending a very clear message.
The charts that follow will give you a sharper, and somewhat surprising, look at what’s really happening.
Second Half of 2025: Median Prices vs Annual Growth
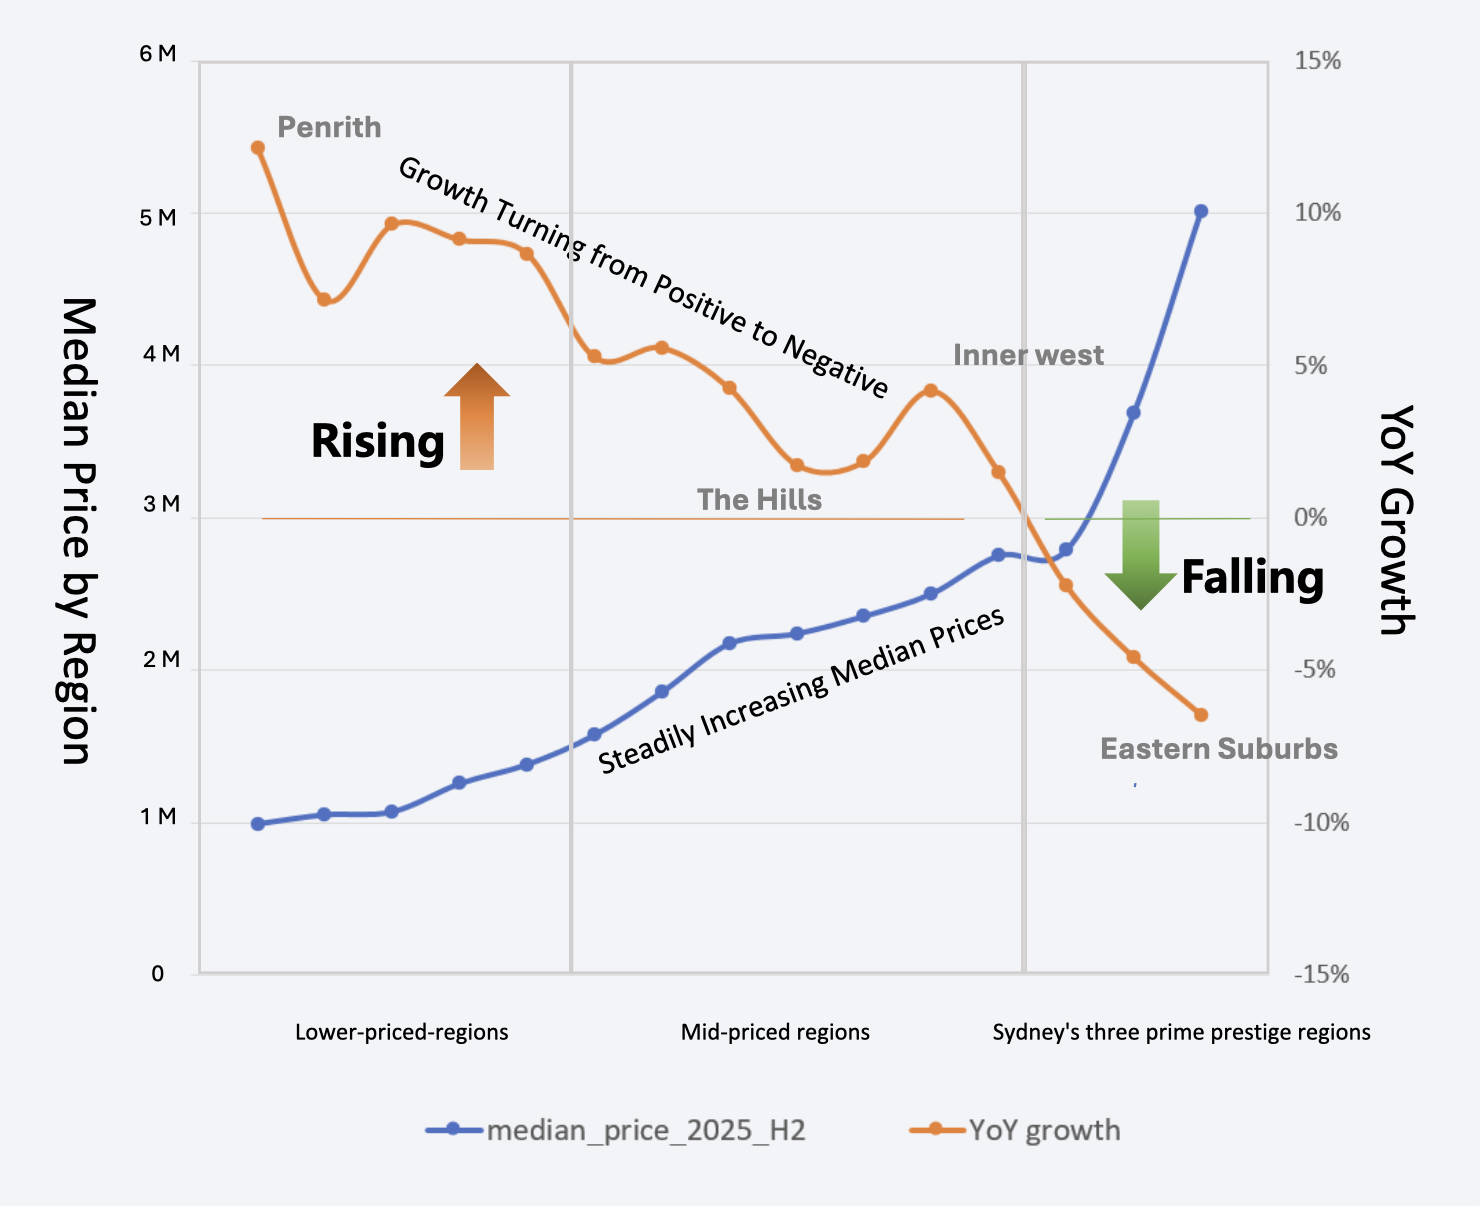
Blue bars show median house prices by region (left axis), while orange bars indicate year-on-year growth (right axis).
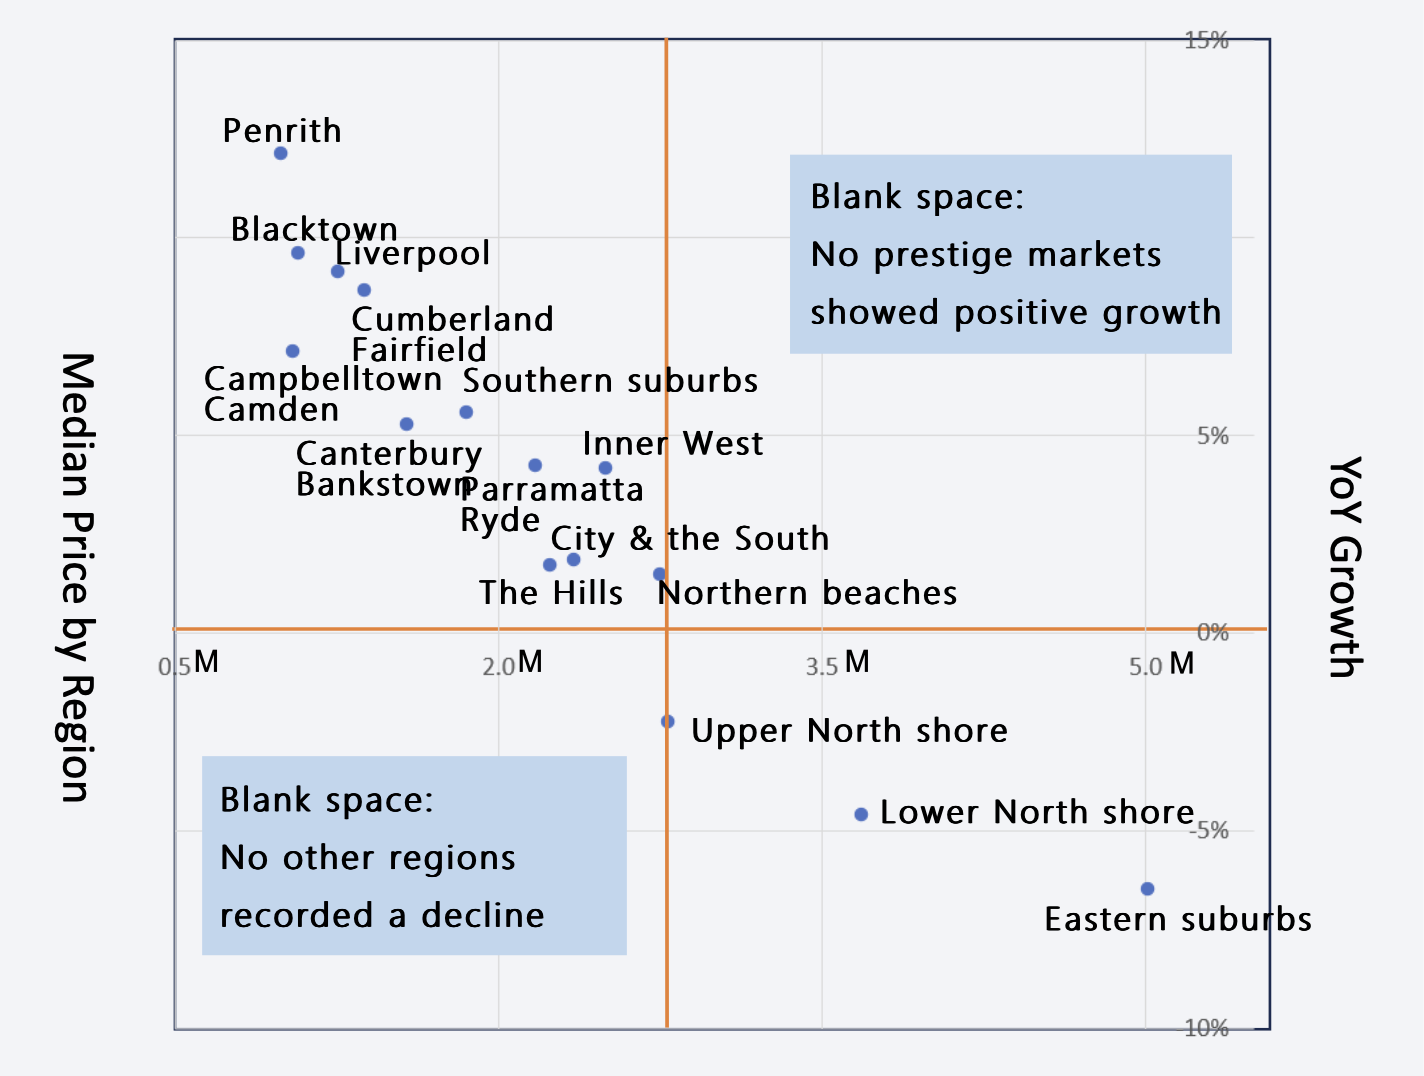
The pattern is clear: the higher the price point, the weaker the growth.
Lower-priced regions rose by close to 10%, mid-priced areas by around 4%, while all three major prestige markets recorded declines.
Sydney’s 2025 market is sharply divided: affordable areas are rising, mid-priced regions are stable, and prestige districts are falling. This report highlights the data behind the split and what it could mean for 2026.
Sydney’s 2025 market is sharply divided: affordable areas are rising, mid-priced regions are stable, and prestige districts are falling. This report highlights the data behind the split and what it could mean for 2026.
Sydney’s 2025 market is sharply divided: affordable areas are rising, mid-priced regions are stable, and prestige distri
Read the full analysis below
Source: Knest.ai research
Where are Sydney’s Major Prestige Home Districts?
These three regions are the ones you’ll want to keep an eye on — they’re set to play a very different role in Sydney’s property performance in 2025.
Even if you’re not actively following the prestige market, the forces driving price movements at the top end often ripple through to other suburbs.
While many reports suggest Sydney house prices are expected to edge higher this year, what matters more is the variation across individual districts. The patterns in 2025 have been unusually consistent, almost as if the market is sending a very clear message.
The charts that follow will give you a sharper, and somewhat surprising, look at what’s really happening.
Second Half of 2025: Median Prices vs Annual Growth
Blue bars show median house prices by region (left axis), while orange bars indicate year-on-year growth (right axis).
The pattern is clear: the higher the price point, the weaker the growth.
Lower-priced regions rose by close to 10%, mid-priced areas by around 4%, while all three major prestige markets recorded declines.
Another Way to Look at It: Median Prices vs Annual Growth
Key Questions Emerging from the Data
Why have prestige housing markets declined at the same time?
Why are lower-priced regions recording such strong growth?
Mid-priced areas appear stable — but is internal divergence already emerging?
With 2025 showing such a clear split, what does this signal for 2026?
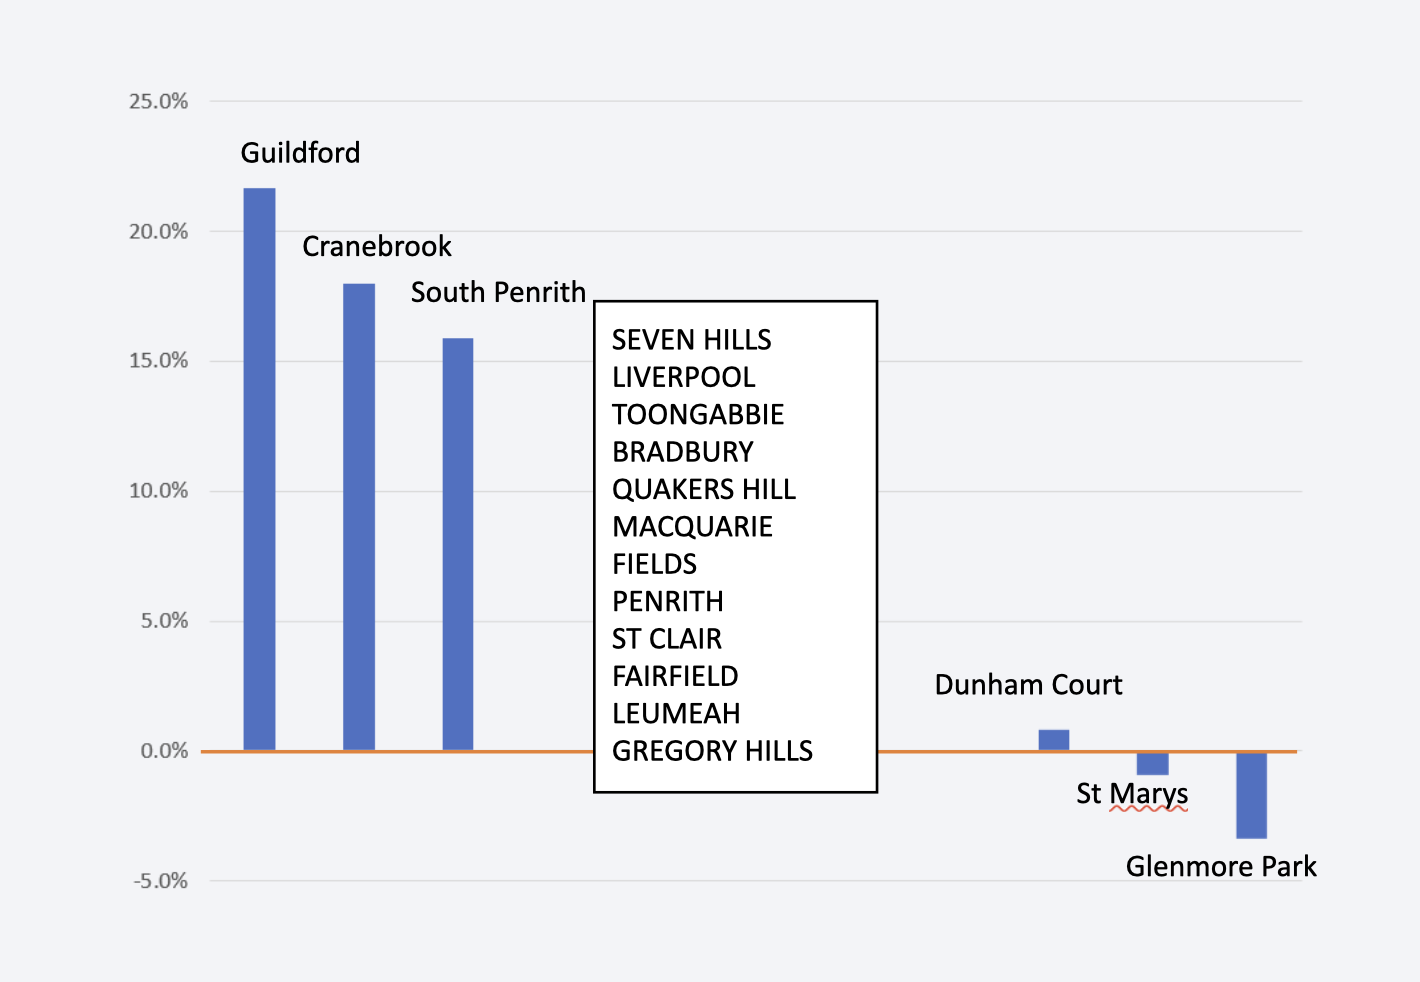
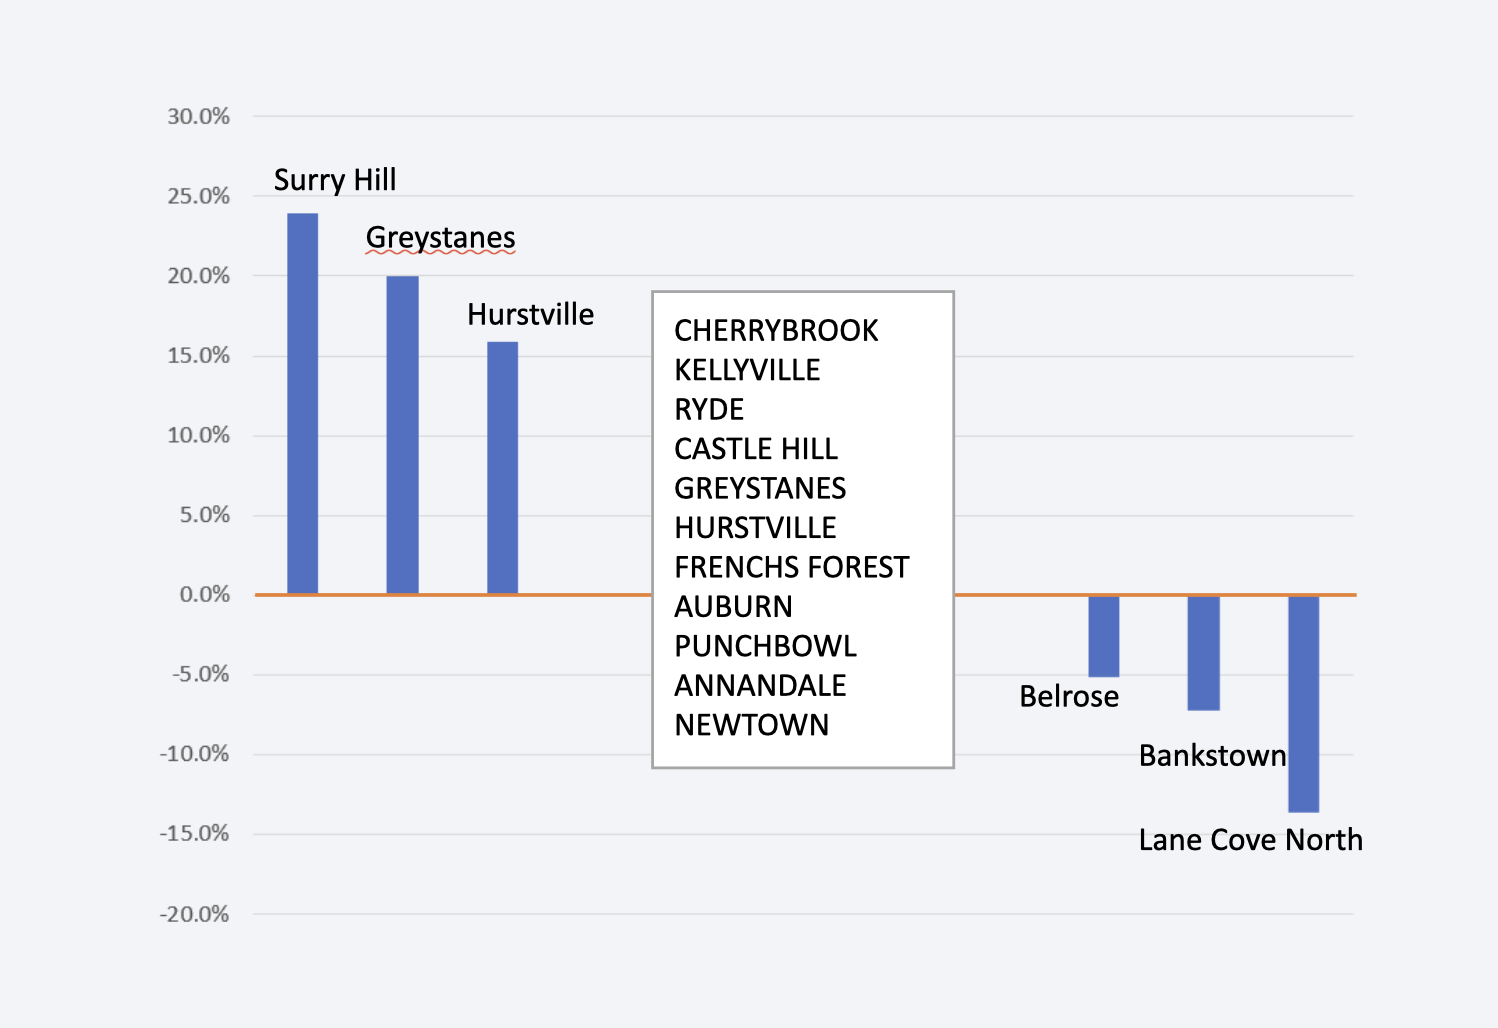
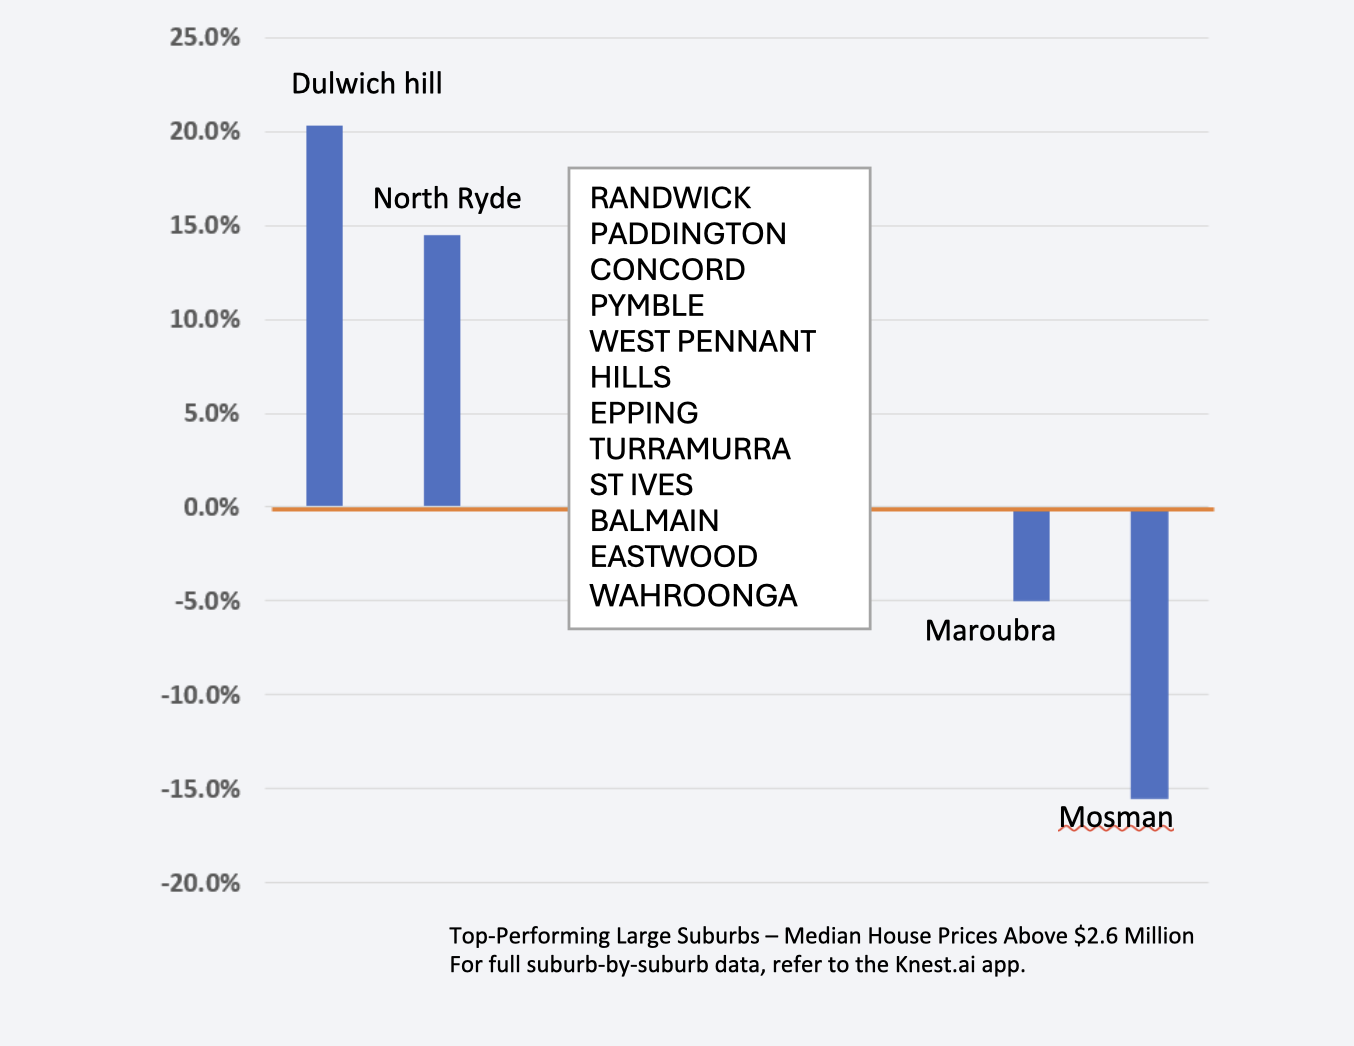
Top Growth High Volume Suburbs
High-volume suburbs are defined as suburbs ranked in the top 100 across Sydney for house sales volume, out of more than 600 suburbs.
The growth ranking is based on each suburb’s median sale price for houses (including duplexes and terraces) in the second half of 2025, measured against the median in the second half of 2024.
The chart shows only the best- and worst-performing suburbs. Full suburb-by-suburb results are available in the Knest.ai app.
Second half of 2025: Median price vs. Annual growth
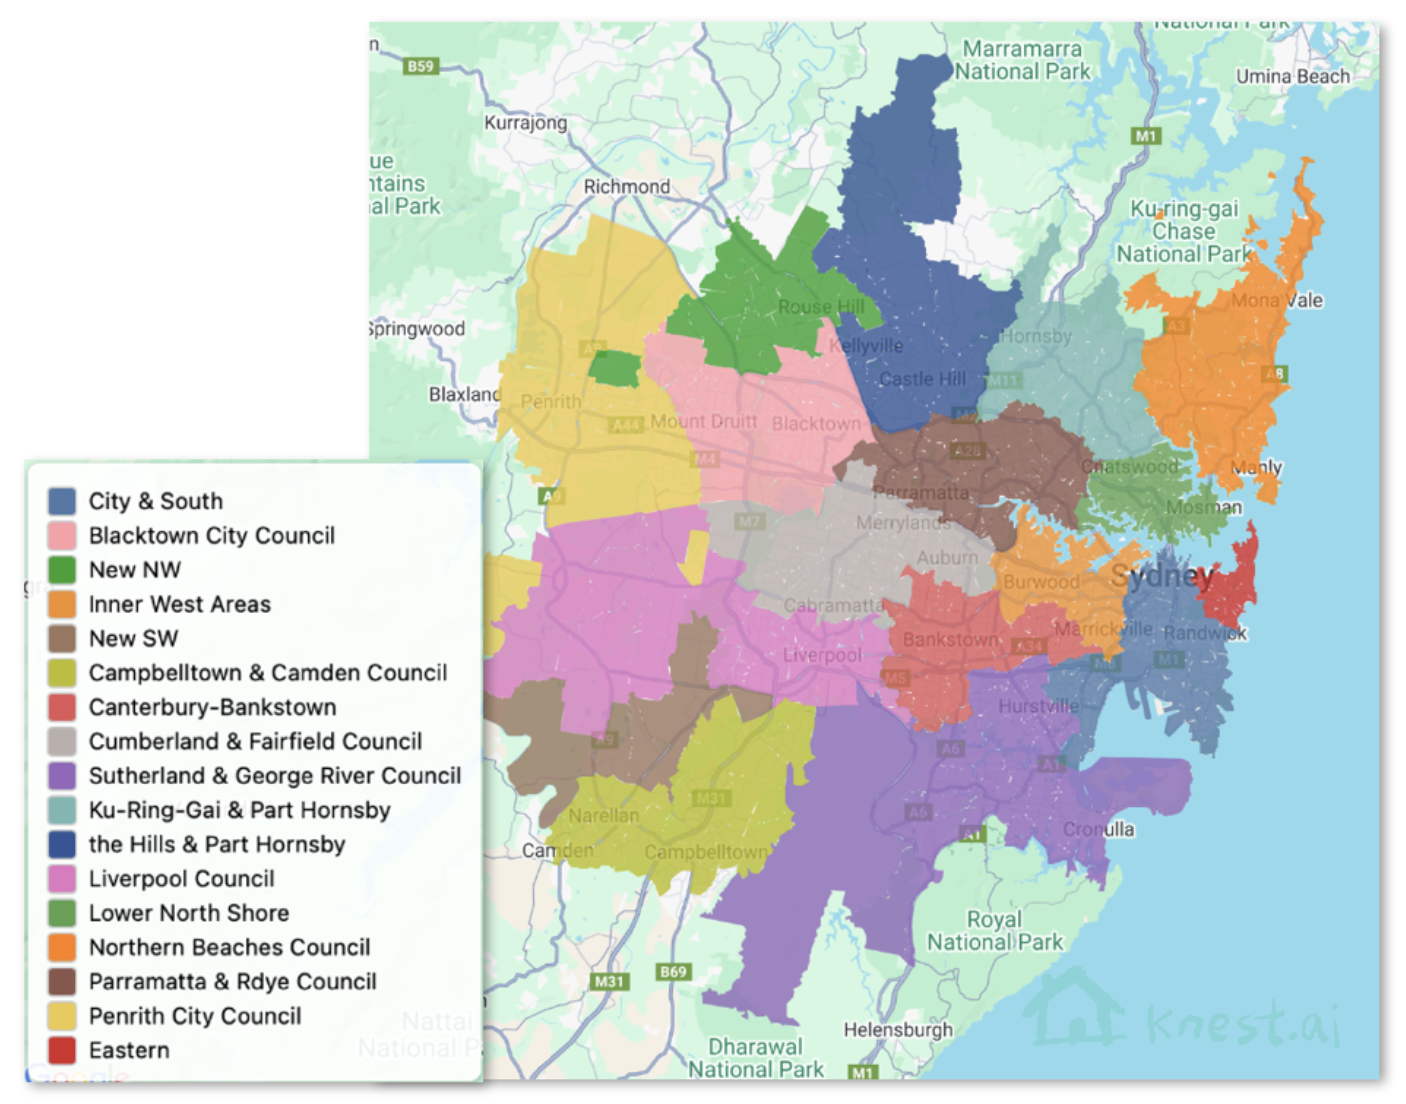
Regional Breakdown
In the chart, New NW and New SW refer to new housing areas in Sydney’s north-west and south-west, where development is predominantly land-and-house packages. Sales of newly built land-and-house packages are excluded from this analysis.
Data Source
Transaction data is sourced from publicly available NSW Government records, combined with other supporting datasets and analysed by Knest.ai. While the data has been cross-checked and validated, the results may still contain inaccuracies and are provided for general reference only.
To better reflect current market conditions, median prices are based on house, duplex and terrace sales from July 2025 onwards, and compared with the same period in 2024. New land-and-house package sales in Sydney’s north-west and south-west growth areas have been excluded to more accurately represent established housing values.
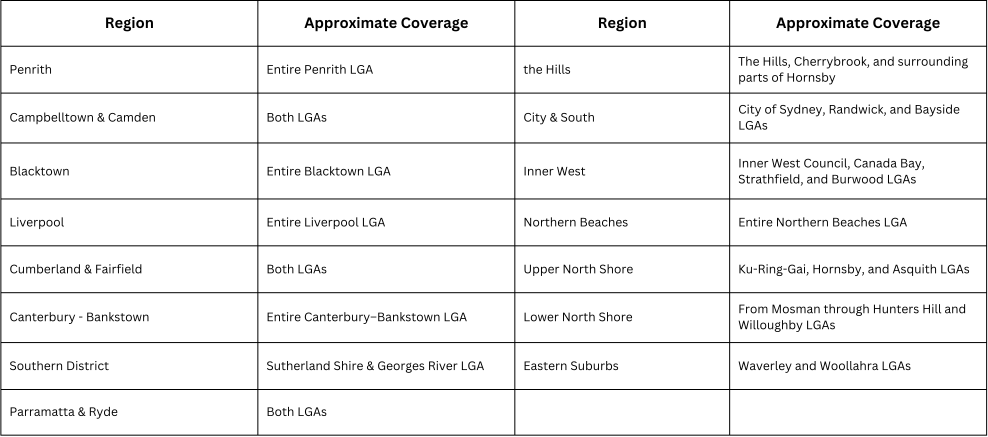
Greater Sydney has been divided into 15 broad regions, grouped at suburb level and broadly aligned with local council boundaries, although regional definitions do not always match council borders exactly. Indicative boundaries for each region are outlined in the table that follows.
Sources
The Knest.ai editorial team
This article is general information only and not financial or legal advice. Data may change; verify before making property decisions.