
Mascot NSW 2020
Mascot is a high-density, multicultural inner-south Sydney suburb in NSW 2020 within the St George region, governed mainly by Bayside Council, with a small part in Inner West Council. It offers strong convenience, with a train station on the T8 line, many bus services, about 20 minutes to the CBD by public transport and about 15 minutes by car. The suburb has good walkability, retail and cultural amenity, and is served by major centres including Westfield Eastgardens. Housing is dominated by apartments rather than houses. Household income is generally above average. Aircraft noise is a notable factor due to Sydney Airport nearby.
The mix of houses and apartments that make up the Mascot NSW 2020 property market, and the sale price range each achieved over the past 12 months.
How close Mascot NSW 2020 properties sit to major roads or rail, and how much traffic noise that brings compared to properties set back from them.
Train, metro, light rail, ferry and B-Line services accessible from Mascot NSW 2020.
"Houses" in this report includes detached houses, duplexes, and terraces.
How house lots across Mascot NSW 2020 sit relative to street level — topography that affects drainage, flood risk, privacy, and build cost.
See which key planning overlays and environmental risks affect this suburb before you buy.
The share of Mascot NSW 2020 houses within easy walking distance (1.2km) of a train station.
The 20-year trend in median house sale prices across Mascot NSW 2020, tracked separately from apartments.
Typical land characteristics and common property features across Mascot NSW 2020.
How property prices vary across the different pockets of Mascot NSW 2020, and how each pocket compares.
The top 3 highest house sales in Mascot NSW 2020 over the past 24 months.


158 popular houses in Mascot NSW 2020
The 20-year trend in median apartment sale prices across Mascot NSW 2020, tracked separately from houses.
Where apartment projects are concentrated across Mascot NSW 2020, with project-level sales context.
The median weekly rent for apartments in Mascot NSW 2020.
The largest apartment projects in Mascot NSW 2020, ranked by number of lots.
447 popular apartments in Mascot NSW 2020
Median age, household income, and the renter-versus-owner split that shape the Mascot NSW 2020 community.
Get the knest.ai app
Gain ultimate insights into any property
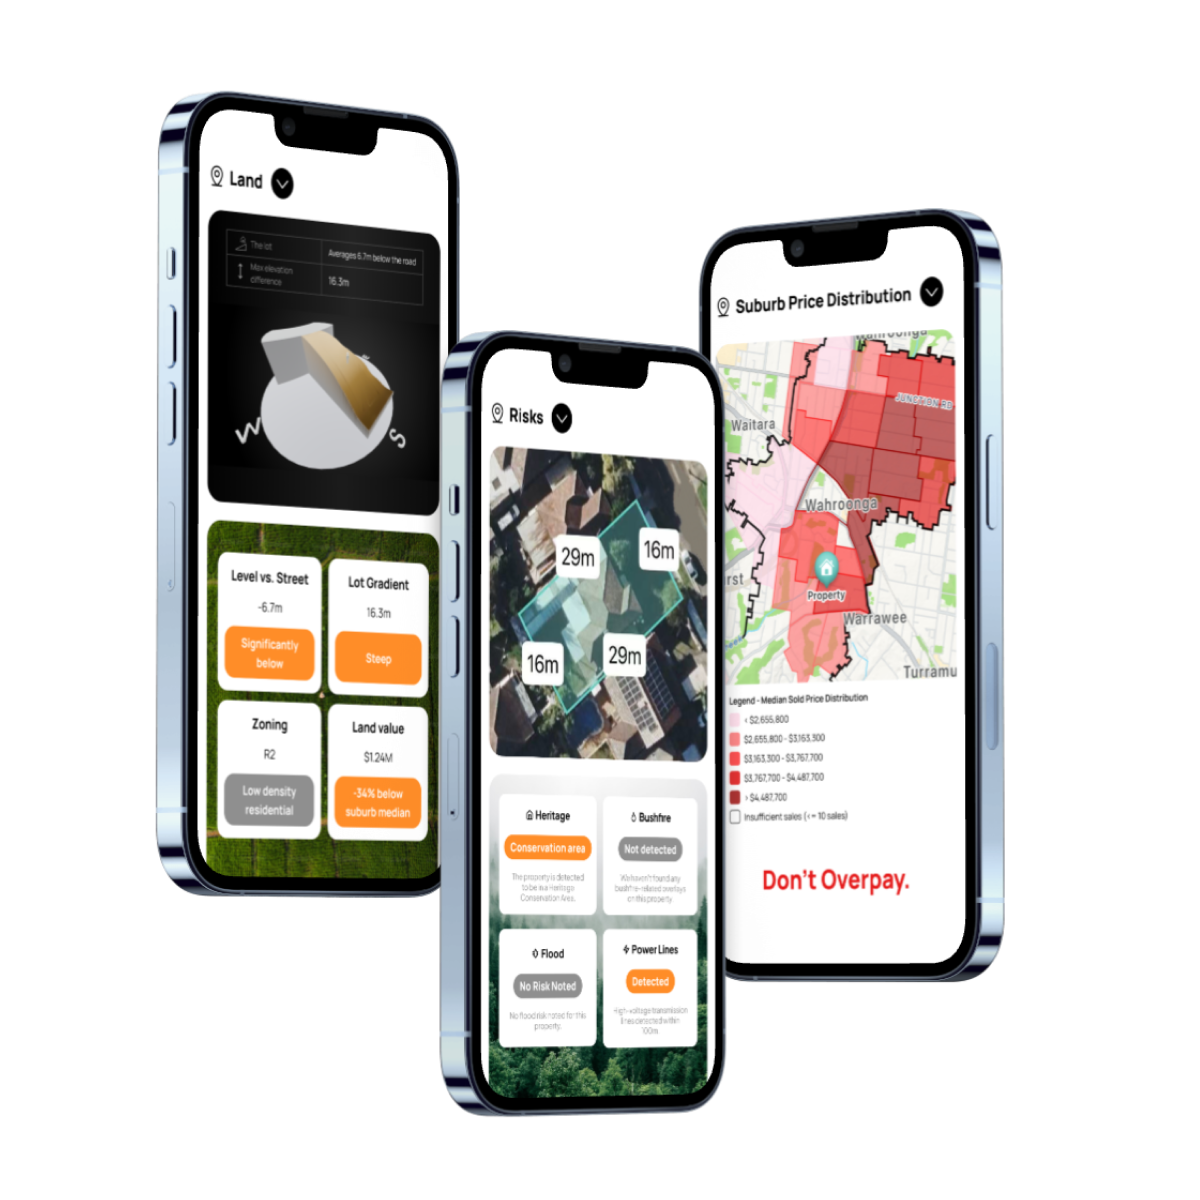
Buyer-focused property platform identifying risks, price estimates, 3D land maps and more to help you make smarter decisions — completely free.

Living in Mascot NSW 2020: Suburb Profile & FAQs
Common questions about living in and buying property in Mascot NSW 2020 — lifestyle, transport, schools, and the housing market.
Note: Data is sourced from the Australian Bureau of Statistics (ABS) 2021 Census data and knest.ai internal statistical data.
Is Mascot NSW 2020 a good suburb for families?
Mascot NSW 2020 is a mixed rather than standout option for families. For buyers asking whether Mascot is a good suburb for families, the strongest positives are its excellent primary school rating of 10 out of 5, solid household size of 2.7 people, and practical day-to-day convenience. Children make up a meaningful share of the population, with about 5.4% aged 0 to 4 and 6.9% aged 5 to 14, so families are clearly part of the suburb mix. That said, Mascot is not a classic low-density family-friendly suburb. Apartments make up 58% of homes, while separate houses are only 30%, and the safety rating sits at 2 out of 5. In buyer terms, Mascot can work well for families who prioritise access, amenities and a more urban lifestyle, but it may feel less peaceful and less spacious than suburbs with a bigger house share and stronger overall safety profile.
What is it like to live in Mascot NSW 2020?
Living in Mascot NSW 2020 feels urban, convenient and fast-moving rather than quiet or leafy. Mascot sits in the St George region and its character is best described as high-density multicultural urban, which matches the data: walkability, retail and culture all score 4 out of 5. For buyers wondering what it is like to live in Mascot, that usually means an everyday lifestyle with good access to shops, services and dining, plus a more active streetscape than many suburban pockets. The trade-off is that Mascot is very built-up, has low canopy cover at 5.11%, and has no beach access, so the environment feels more practical than scenic. Safety is also only 2 out of 5, which tempers the convenience story. Mascot suits buyers who want an energetic, connected suburb close to amenities, but it is less suited to those chasing a calm, green or village-style lifestyle.
Is Mascot NSW 2020 well connected for commuting?
Mascot NSW 2020 is well connected for commuting, especially for buyers who rely on public transport. The suburb has train access on the T8 line, many bus services, and average CBD travel times of about 20 minutes by public transport and 15 minutes by car. For Sydney buyers searching for a suburb with strong commute options, Mascot performs well because it combines direct rail access with a location that keeps travel times relatively short. It does not currently have metro, light rail or ferry service, so the transport mix is good rather than all-round comprehensive. That matters more to buyers who like multiple backup options or who travel across different parts of Sydney. Even so, Mascot remains a strong commuter suburb for professionals and households who value efficient access to the city, airport-side employment areas and broader transport links without necessarily needing a car for every trip.
Who does Mascot NSW 2020 suit best?
Mascot NSW 2020 suits professionals, couples, and urban-minded buyers who want convenience first. The resident profile leans clearly in that direction: professionals are the largest occupation group at 25.6%, managers add another 14.0%, and clerical and administrative workers make up 14.8%. Around 39.5% of residents are managers or professionals overall, the median personal income is $806 weekly, the median family income is $2,103 weekly, and the median age is 32, all of which point to a relatively young, working population. The housing mix matters too. With 58% apartments, 30% separate houses, and about 47.5% renters, Mascot is better matched to buyers comfortable with higher-density living and a more active local market. It is less naturally suited to buyers who want large land, a quieter family setting, or a traditional detached-house suburb. Mascot works best for people who value access, transport and everyday practicality over space and suburb calm.
What are the pros and cons of living in Mascot NSW 2020?
The main trade-off in Mascot NSW 2020 is simple: you gain strong convenience and commuting access, but you give up some space, greenery and calm. On the plus side, Mascot scores 4 out of 5 for walkability, retail and culture, has train access on the T8 line, many bus services, and a short average CBD commute of 20 minutes by public transport. That makes daily life easier for buyers who want shops, transport and work access close at hand. The compromises are just as important. Mascot is heavily urban and built-up, canopy cover is only 5.11%, apartments make up 58% of homes, and safety is rated 2 out of 5. For some buyers, especially those with children or a preference for quieter streets, those factors may feel limiting. For others, especially commuters and apartment buyers, Mascot’s convenience can easily outweigh those drawbacks.
What are property prices like in Mascot NSW 2020?
Property prices in Mascot NSW 2020 are mid-range to expensive by Sydney buyer expectations, with a clear gap between apartments and houses. Over the recent sales sample, apartments had a median price of $865,000 across 113 sales, while houses had a median price of $1,711,000 across 19 sales. For buyers researching property prices in Mascot, that suggests apartments are the main entry point into the suburb, while houses are much harder to access and come with far tighter supply. In practical terms, buying property in Mascot usually means deciding whether you want convenience and a lower price point through an apartment, or whether you are prepared to pay much more for a house in a suburb where detached homes are not the dominant format. The trade-off is straightforward: apartments offer a more reachable way into Mascot, while houses cost more because land is relatively scarce in this higher-density location.
19 surrounding suburbs near Mascot NSW 2020
90 streets in Mascot NSW 2020