
Campbelltown NSW 2560
Campbelltown, NSW 2560, is a major urban centre in Sydney’s South West and Macarthur region, governed by Campbelltown City Council. It has strong rail access on the T2 and T8 lines, extensive bus services, and around 70 minutes to the CBD by public transport. The suburb is characterised as a regional city centre with an urban built-up setting, 13% canopy cover, strong retail presence, and average walkability. Housing is led by separate houses, with a substantial apartment component. Macarthur Square, the largest shopping centre in southwestern Sydney, is a major regional drawcard. Household income is generally below average.
The mix of houses and apartments that make up the Campbelltown NSW 2560 property market, and the sale price range each achieved over the past 12 months.
How close Campbelltown NSW 2560 properties sit to major roads or rail, and how much traffic noise that brings compared to properties set back from them.
Train, metro, light rail, ferry and B-Line services accessible from Campbelltown NSW 2560.
"Houses" in this report includes detached houses, duplexes, and terraces.
How house lots across Campbelltown NSW 2560 sit relative to street level — topography that affects drainage, flood risk, privacy, and build cost.
See which key planning overlays and environmental risks affect this suburb before you buy.
The share of Campbelltown NSW 2560 houses within easy walking distance (1.2km) of a train station.
The 20-year trend in median house sale prices across Campbelltown NSW 2560, tracked separately from apartments.
Typical land characteristics and common property features across Campbelltown NSW 2560.
How property prices vary across the different pockets of Campbelltown NSW 2560, and how each pocket compares.
The top 3 highest house sales in Campbelltown NSW 2560 over the past 24 months.


341 popular houses in Campbelltown NSW 2560
The 20-year trend in median apartment sale prices across Campbelltown NSW 2560, tracked separately from houses.
Where apartment projects are concentrated across Campbelltown NSW 2560, with project-level sales context.
The median weekly rent for apartments in Campbelltown NSW 2560.
The largest apartment projects in Campbelltown NSW 2560, ranked by number of lots.
313 popular apartments in Campbelltown NSW 2560
Median age, household income, and the renter-versus-owner split that shape the Campbelltown NSW 2560 community.
Get the knest.ai app
Gain ultimate insights into any property
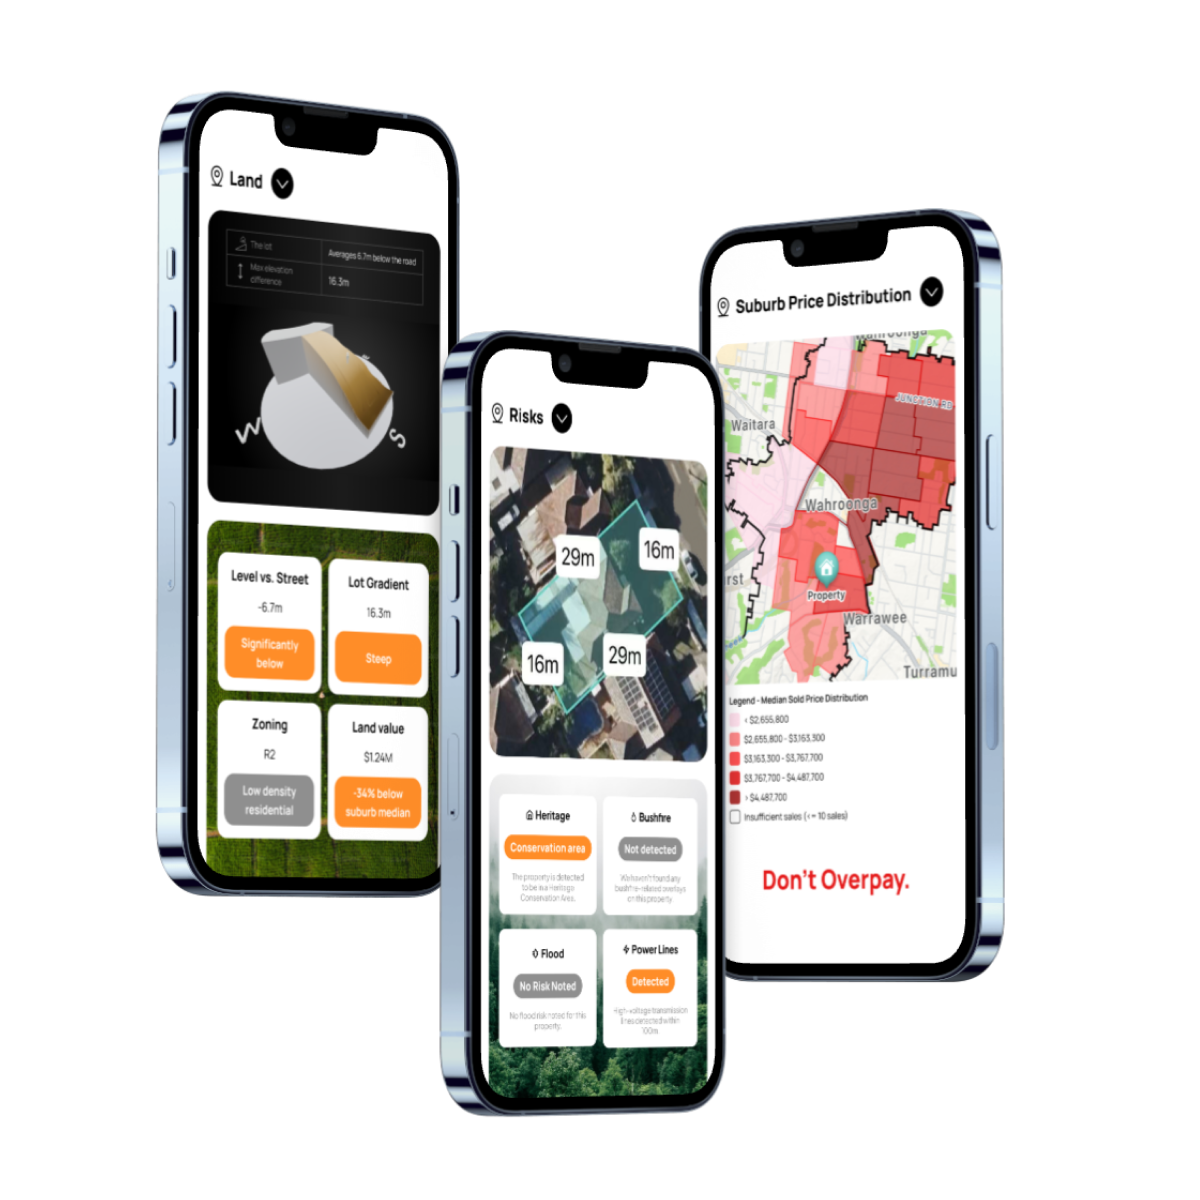
Buyer-focused property platform identifying risks, price estimates, 3D land maps and more to help you make smarter decisions — completely free.

Living in Campbelltown NSW 2560: Suburb Profile & FAQs
Common questions about living in and buying property in Campbelltown NSW 2560 — lifestyle, transport, schools, and the housing market.
Note: Data is sourced from the Australian Bureau of Statistics (ABS) 2021 Census data and knest.ai internal statistical data.
Is Campbelltown NSW 2560 a good suburb for families?
Campbelltown NSW 2560 is a mixed but solid option for families, especially buyers who want more house choice without pushing into Sydney’s premium price brackets. The schooling indicators are strong, with both primary and secondary education rated 8 out of 10, and the suburb has a meaningful family base, with 6.3% of residents aged 0 to 4 and 10.6% aged 5 to 14. Housing also leans toward family use more than inner-city apartment areas, with 58% separate houses and an average household size of 2.4 people. That gives many family buyers a more practical starting point if they want space, bedrooms, and a backyard. The trade-off is that safety sits at 1 out of 5, so while Campbelltown can still work well for families focused on schools, budget, and house access, buyers who prioritise a quieter or more reassuring feel may want to be selective about pocket, street, and immediate surroundings.
What is it like to live in Campbelltown NSW 2560?
Living in Campbelltown NSW 2560 feels urban, practical, and centre-based rather than quiet and village-like. It functions as a regional city centre in South West & Macarthur, so daily life is shaped by convenience and activity more than by a leafy residential atmosphere. Retail is a strong point at 5 out of 5, culture is 4 out of 5, and walkability is 3 out of 5, which together suggest a suburb where shopping, services, and day-to-day errands are easier than in many outer areas. That suits buyers who want an active suburb lifestyle with infrastructure around them. The trade-off is environmental softness. Campbelltown is described as urban and built-up, with only 13% canopy cover and no beach access, so it is not the sort of suburb buyers usually choose for a green, tranquil feel. For some households that is a fair exchange for convenience; for others, it may feel a little too hard-edged.
Is Campbelltown NSW 2560 well connected for commuting?
Campbelltown NSW 2560 is well connected for commuting by outer-Sydney standards, particularly for buyers who value train access and strong local bus coverage. The suburb has a train station on the T2 and T8 lines, bus services are rated many, and that gives residents a genuine public transport network rather than a bus-only setup. Average commuting time to the Sydney CBD is about 70 minutes by public transport and 45 minutes by car, so Campbelltown is workable for CBD commuters but not especially quick. In practical terms, it is better suited to buyers who commute a few days a week, work locally in the south-west, or can tolerate a longer trip in exchange for a lower entry price and more space. The limitation is that there is no metro, no light rail, and no ferry, so despite solid rail access, Campbelltown still does not offer the transport variety or shorter city runs that more inner suburbs can provide.
Who does Campbelltown NSW 2560 suit best?
Campbelltown NSW 2560 suits buyers who want a practical Sydney entry point with a real town-centre feel, especially families, upgraders, and budget-conscious professionals. The suburb’s housing mix is still mainly house-led, with 58% separate houses compared with 27% apartments, which helps buyers looking for more space than apartment-heavy areas typically offer. The resident profile is also broad rather than niche. Professionals are the largest occupation group at 17.6%, followed by clerical and administrative workers at 14.2% and trades at 12.6%, which points to a mixed working suburb rather than an ultra-prestige or highly investor-only market. Median weekly family income of $1,455 and median age of 35 reinforce that mainstream family-buyer profile. The trade-off is that it may suit buyers seeking lifestyle polish, exclusivity, or a quieter prestige environment less well. Campbelltown is more about functionality, access, and value than about status or a boutique village atmosphere.
What are the pros and cons of living in Campbelltown NSW 2560?
The main trade-off in Campbelltown NSW 2560 is that buyers get strong everyday convenience and comparatively accessible housing, but they give up some calm, greenery, and reassurance in the process. On the plus side, Campbelltown has strong retail amenity at 5 out of 5, good cultural activity at 4 out of 5, train access on the T2 and T8 lines, many bus services, and a housing profile that still includes a majority of separate houses. That makes it appealing for buyers who want a suburb where daily life works well and where houses are still part of the mainstream market. The downside is that safety is rated 1 out of 5, canopy cover is only 13%, and the setting is clearly urban and built-up rather than leafy or serene. Buyers who care most about atmosphere and peace will notice that compromise more. For buyers focused on practicality, schools, transport, and budget, Campbelltown can still be a very workable fit.
What are property prices like in Campbelltown NSW 2560?
Property prices in Campbelltown NSW 2560 are relatively affordable for Sydney, especially for buyers comparing it with many middle-ring and prestige-house markets. In the recent six-month sales data, the median house price was about $1.068 million, while the median apartment price was about $590,000. That creates two fairly different entry points. Houses in Campbelltown sit in a range that is still substantial but more attainable than many family-house suburbs closer to the CBD, while apartments offer a much lower threshold for first-home buyers, investors, or downsizers wanting access to a major centre. The practical meaning is that Campbelltown can open the door to more land and more bedrooms than buyers might afford elsewhere. The trade-off is that the lower price point reflects the suburb’s outer location and mixed lifestyle profile, so buyers are typically paying less in exchange for a longer CBD commute and a more urban, less polished suburban feel.
25 surrounding suburbs near Campbelltown NSW 2560
206 streets in Campbelltown NSW 2560